
Places in the U.S. Most Vulnerable to Housing Displacement
Housing instability is a growing concern across the United States, with many communities facing risks to their housing units from natural disasters and financial hardship. This past year, thousands of Americans were displaced from their homes—whether due to hurricanes, wildfires, or the inability to keep up with rent or mortgage payments. These challenges highlight the fragile balance between economic stability and housing security.
In this study, we analyzed U.S. Census Household Pulse Survey data to identify the states and cities most at risk of housing displacement. By examining two key factors—displacement caused by natural disasters and the likelihood of eviction or foreclosure—we ranked regions based on their vulnerability. The results offer a deeper look at how financial strain and environmental risks impact housing stability across the country.
Keep reading to discover which spots face the greatest challenges and what these insights mean for homeowners, renters, and real estate investors.
Insights Around Foreclosures and Displacement
- The Northeast has the highest eviction and foreclosure risk, with 151 adults per 100K residents at risk—20% higher than the South and over 30% higher than the West.
- Mississippi (2,565 adults at risk per 100k), Maryland (2,452), and Georgia (2,289) have the highest risk of eviction/foreclosure rates at the state level.
- The South faces the highest disaster-driven displacement risk, with Louisiana (3,990 displaced per 100K residents) leading the nation, followed by Texas (2,941) and Florida (2,828).
- Of the top 15 largest cities, Houston, TX, ranks #1 in both natural disaster displacement and eviction risk, with 9,166 displaced adults per 100K and 2,377 at risk of eviction or foreclosure.
- Some states face high risks from disasters and financial strain—Texas, Maine, and Mississippi each rank in the top 10 for both displacement factors.
- A handful of states have low risks across the board, with Utah, Minnesota, and Wisconsin ranking among the lowest for both natural disaster-driven displacement and eviction/foreclosure risk.
Where Americans Are Struggling Most — and Least — to Stay in Their Homes
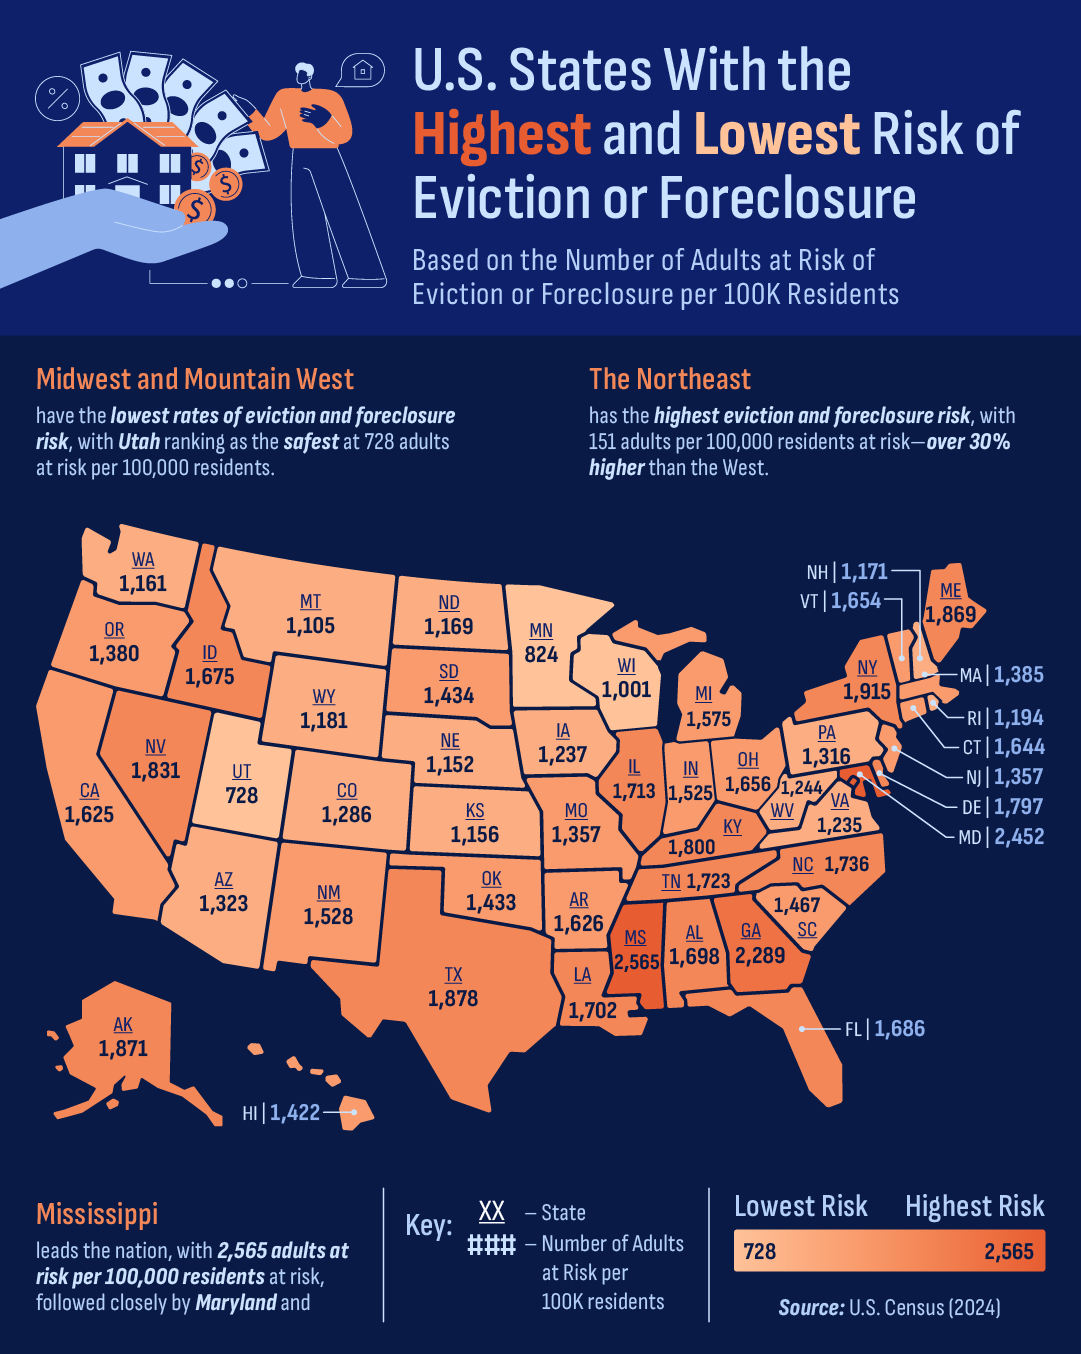
States with the Highest Risk of Eviction or Foreclosure
- Mississippi – 2,565 at risk per 100K residents
- Maryland – 2,452 at risk per 100K residents
- Georgia – 2,289 at risk per 100K residents
- New York – 1,915 at risk per 100K residents
- Texas – 1,878 at risk per 100K residents
- Alaska – 1,871 at risk per 100K residents
- Maine – 1,869 at risk per 100K residents
- Nevada – 1,831 at risk per 100K residents
- Kentucky – 1,800 at risk per 100K residents
- Delaware – 1,797 at risk per 100K residents
The data shows that Mississippi has the highest eviction and foreclosure rate in the country, with 2,565 adults per 100,000 residents at risk of losing their homes. Maryland (2,452) and Georgia (2,289) follow closely behind, signaling widespread financial strain in these states.
Notably, New York (1,915) and Texas (1,878)—two states with high living costs and large populations—also rank among the top five. Meanwhile, Alaska (1,871) and Maine (1,869), which don’t typically top lists of housing instability, saw surprisingly high eviction and foreclosure risks. This could be linked to economic challenges in rural areas, where job opportunities and affordable housing options may be more limited.
States with the Lowest Risk of Eviction or Foreclosure
- Utah – 728 adults at risk per 100K residents
- Minnesota – 824 at risk per 100K residents
- Wisconsin – 1,001 at risk per 100K residents
- Montana – 1,105 at risk per 100K residents
- Nebraska – 1,152 at risk per 100K residents
- Kansas – 1,156 at risk per 100K residents
- Washington – 1,161 at risk per 100K residents
- North Dakota – 1,169 at risk per 100K residents
- New Hampshire – 1,171 at risk per 100K residents
- Wyoming – 1,181 at risk per 100K residents
On the other end of the spectrum, Utah reports the lowest eviction and foreclosure risk, with just 728 adults per 100,000 residents at risk. Other states with low housing instability include Minnesota (824), Wisconsin (1,001), and Montana (1,105). These states generally have lower housing costs and more stable employment rates, possibly contributing to their lower eviction risks.
Interestingly, Washington (1,161) and New Hampshire (1,171) also rank among the states with the lowest risk. Despite their higher housing costs, these states may offer stronger tenant protections, financial assistance programs, or more stable job markets, helping to reduce displacement.
Eviction and Foreclosure Risk by Region
- Northeast – 151 at risk per 100K residents
- South – 126 at risk per 100K residents
- Midwest – 119 at risk per 100K residents
- West – 113 at risk per 100K residents
When examining eviction and foreclosure risk by region, the Northeast emerges as the most vulnerable, with 151 adults per 100,000 residents at risk—a 20% higher risk than the South and over 30% higher than the West. This aligns with the region’s high cost of living and the economic pressures facing many urban renters and homeowners.The South (126), Midwest (119), and West (113) report lower risks, though financial strain remains a pressing issue across all regions.
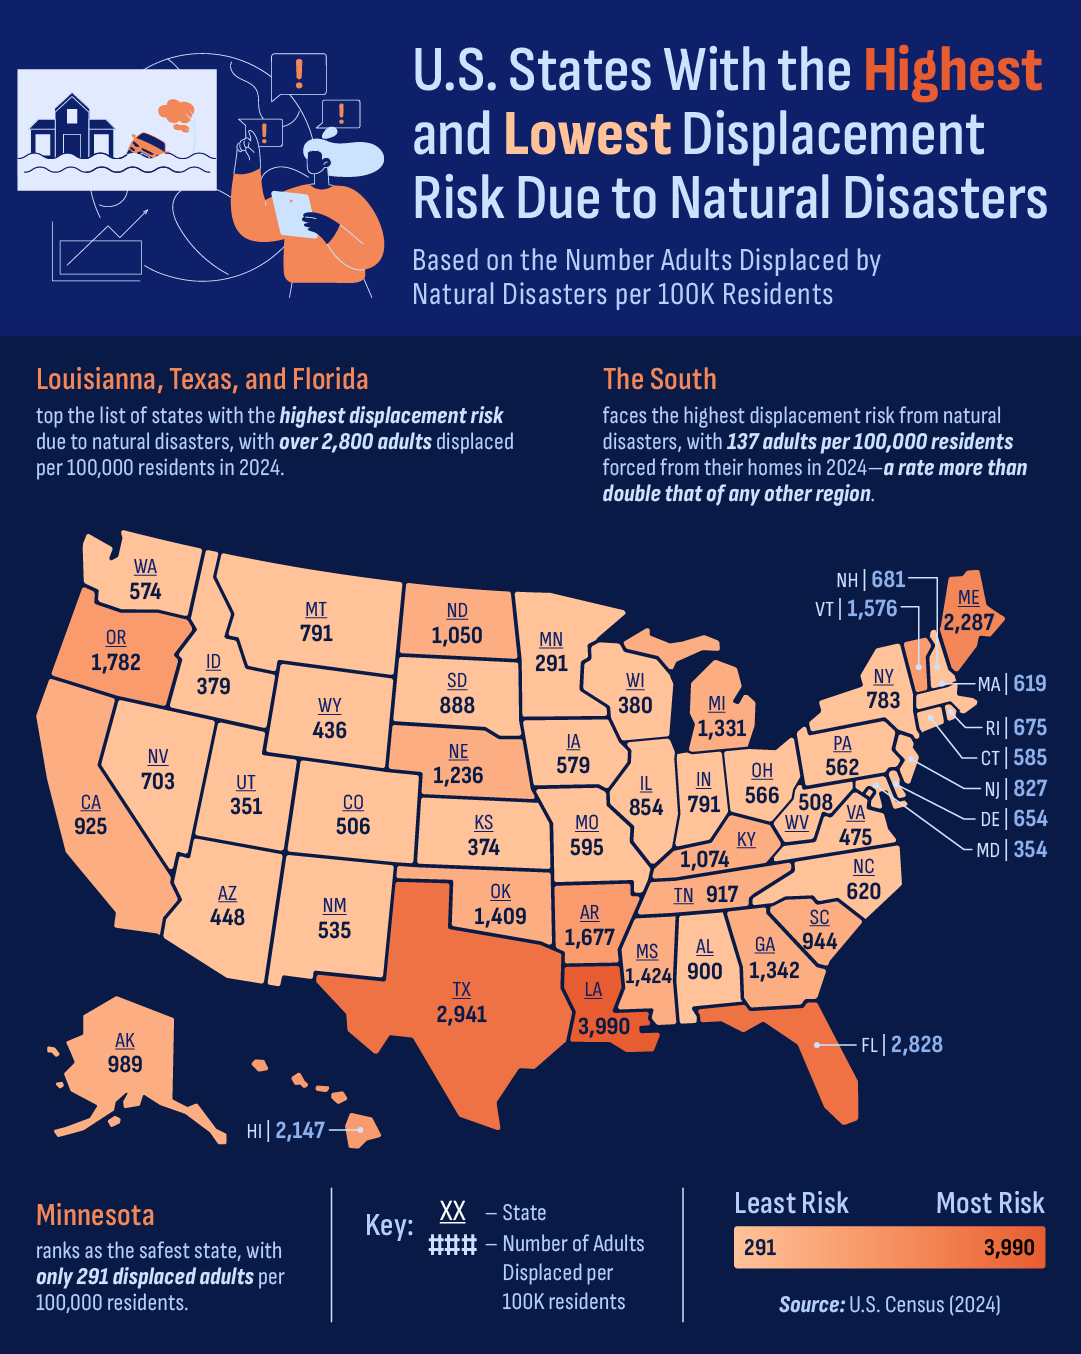
States Most at Risk of Disaster-Driven Housing Displacement
- Louisiana – 3,990 displaced per 100K residents
- Texas – 2,941 displaced per 100K residents
- Florida – 2,828 displaced per 100K residents
- Maine – 2,287 displaced per 100K residents
- Hawaii – 2,147 displaced per 100K residents
- Oregon – 1,782 displaced per 100K residents
- Arkansas – 1,677 displaced per 100K residents
- Vermont – 1,576 displaced per 100K residents
- Mississippi – 1,424 displaced per 100K residents
- Oklahoma – 1,409 displaced per 100K residents
The data reveals that Southern and coastal states face the highest risk of displacement due to natural disasters, with Louisiana leading the nation at 3,990 displaced adults per 100,000 residents. Texas (2,941) and Florida (2,828)—both highly prone to hurricanes and extreme weather—follow closely behind. Other high-risk states include Maine (2,287), Hawaii (2,147), and Oregon (1,782), where residents face threats from coastal storms, volcanic activity, and wildfires.
Notably, Maine and Vermont, which are not typically associated with high disaster housing displacement, rank in the top 10. This may be due to severe winter storms or inland flooding events that have increasingly impacted the Northeast.
States with the Lowest Risk of Disaster-Driven Housing Displacement
- Minnesota – 291 displaced per 100K residents
- Utah – 351 displaced per 100K residents
- Maryland – 354 displaced per 100K residents
- Kansas – 374 displaced per 100K residents
- Idaho – 379 displaced per 100K residents
- Wisconsin – 380 displaced per 100K residents
- Wyoming – 436 displaced per 100K residents
- Arizona – 448 displaced per 100K residents
- Virginia – 475 displaced per 100K residents
- Colorado – 506 displaced per 100K residents
On the other end of the spectrum, Midwestern and Western states tend to have lower displacement rates. Minnesota reports the lowest disaster-driven displacement, with just 291 adults per 100,000 residents forced to relocate in 2024. Other states with minimal displacement include Utah (351), Maryland (354), and Kansas (374)—regions that experience fewer large-scale natural disasters compared to coastal areas.
Interestingly, Arizona (448) and Colorado (506) are low-risk states despite their susceptibility to wildfires and drought. This could indicate that, while these states experience environmental hazards, they may not lead to large-scale displacement at the same rate as hurricanes or floods in other regions.
Disaster Displacement by Region
- South – 137 displaced per 100K residents
- Northeast – 65 displaced per 100K residents
- West – 63 displaced per 100K residents
- Midwest – 62 displaced per 100K residents
When analyzing displacement by region, the South emerges as the most vulnerable, with 137 adults per 100,000 residents displaced—more than double the rate of any other U.S. region. This aligns with the prevalence of hurricanes, tornadoes, and flooding events frequently impacting states like Louisiana, Texas, and Florida.
By contrast, the Northeast (65), West (63), and Midwest (62) report significantly lower displacement rates, likely due to fewer catastrophic weather events in these regions. However, as climate patterns shift and extreme weather events become more frequent, these numbers may change in the years to come.
The Top 15 Largest Metros Ranked by Risk of Housing Displacement
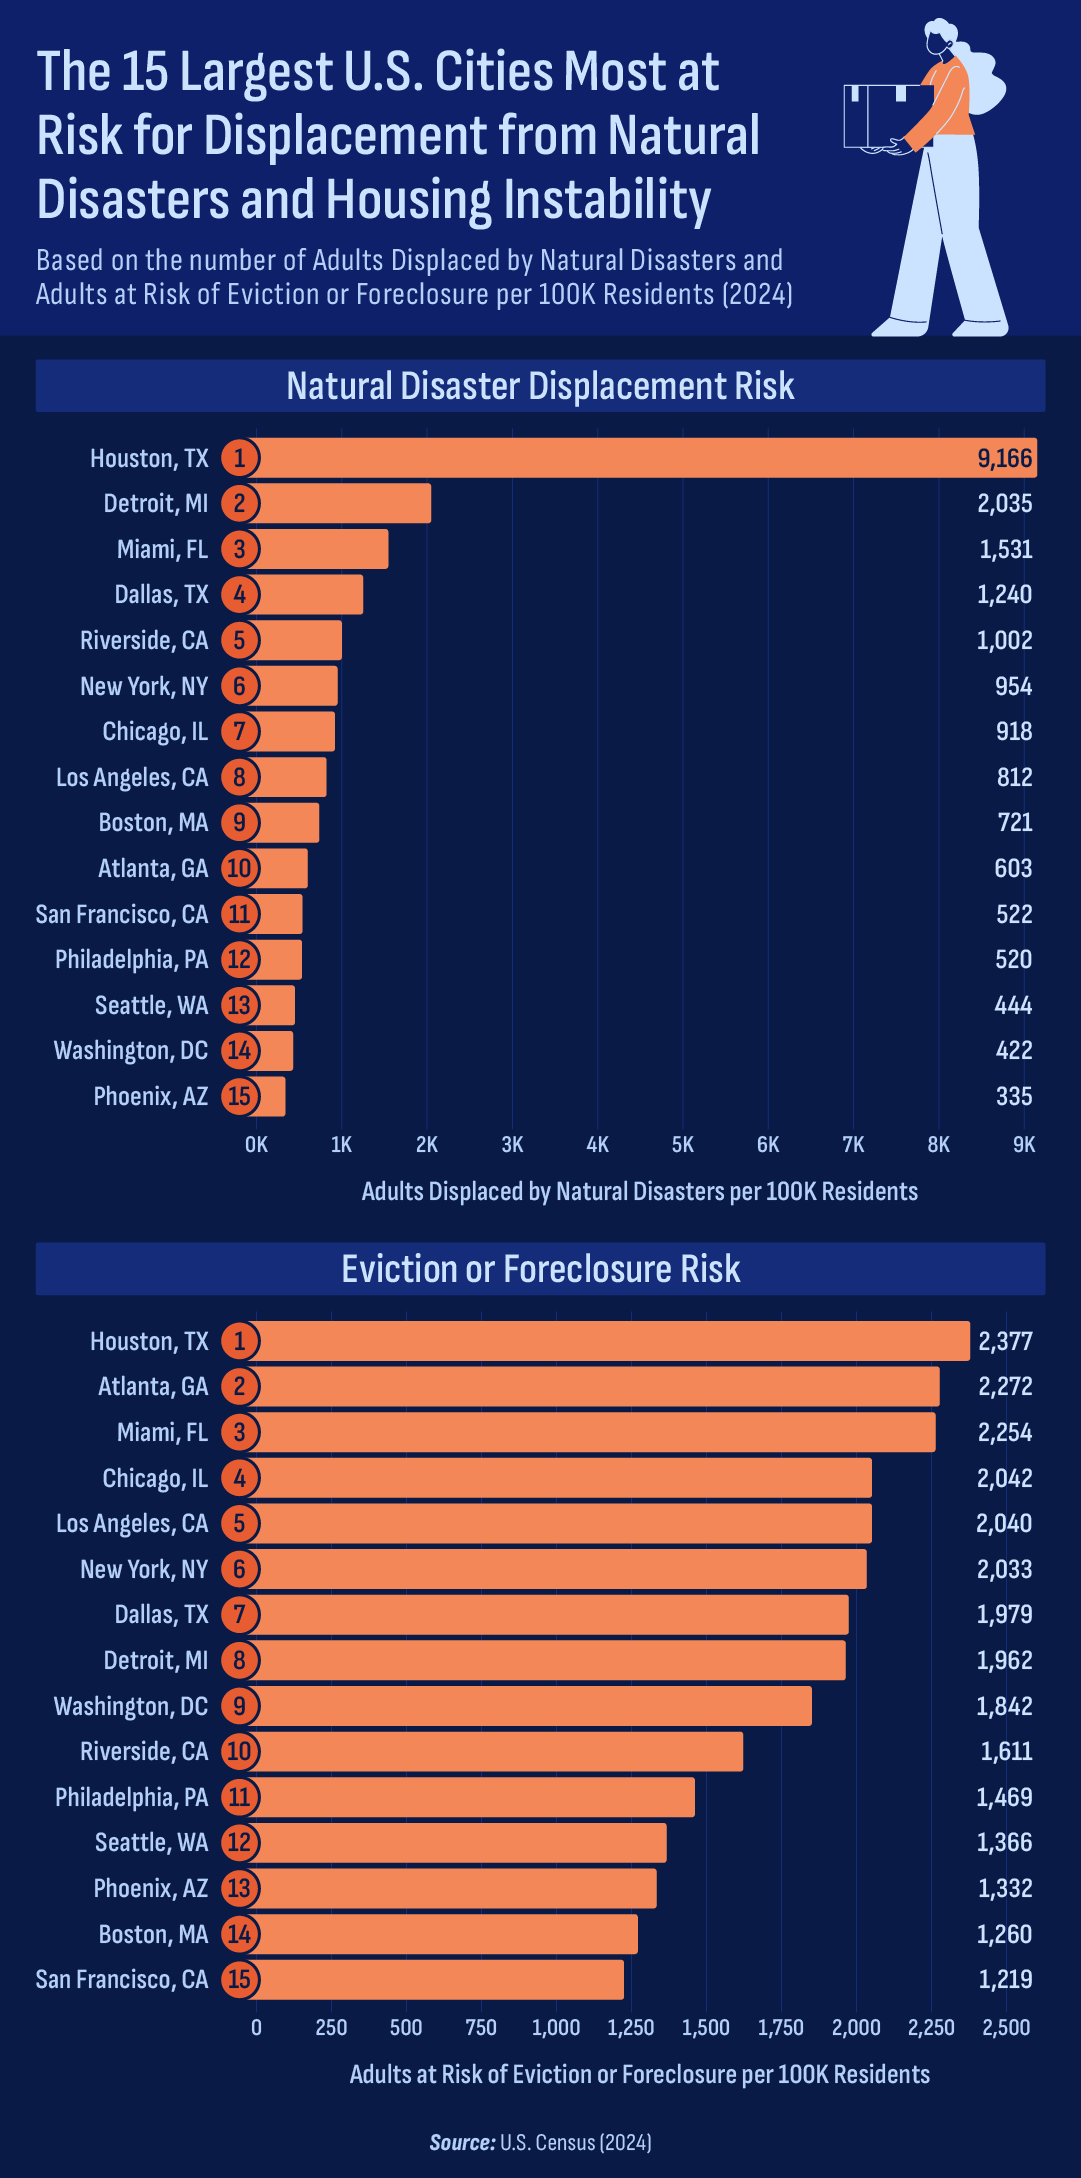
Cities with the Highest Risk of Natural Disaster Housing Displacement
Unsurprisingly, Houston, TX, tops the list, with 9,166 adults per 100,000 residents displaced due to natural disasters in 2024. Given the city’s vulnerability to hurricanes, severe flooding, and extreme weather, this high figure reflects the ongoing housing instability caused by environmental factors.
Following Houston, Detroit, MI (2,035) and Miami, FL (1,531) rank among the metro areas with the highest disaster-driven displacement. Dallas, TX (1,240), Riverside, CA (1,002), and New York, NY (954) also experience notable displacement risks, often due to hurricanes, wildfires, and coastal storms.
Interestingly, cities like Boston, MA (721), San Francisco, CA (522), and Seattle, WA (444) make the list despite not being traditional disaster hotspots. This suggests that less frequent but impactful events—such as winter storms, earthquakes, or wildfires—still pose significant threats to urban housing stability.
Cities with the Highest Risk of Eviction or Foreclosure
Financial distress plays a major role in displacement risk, and Houston, TX, once again ranks #1, with 2,377 adults per 100,000 residents at risk of eviction or foreclosure. Economic hardship, job market fluctuations, and rising housing costs contribute to the city’s struggles.
Atlanta, GA (2,272), Miami, FL (2,254), and Chicago, IL (2,042) also rank high, reflecting economic pressures in these major metropolitan areas. Meanwhile, Los Angeles, CA (2,040) and New York, NY (2,033)—two of the most expensive housing markets in the U.S.—see thousands of residents struggling to keep up with payments.
Among the cities with comparatively lower but still notable risks, Washington, DC (1,842), Riverside, CA (1,611), and Seattle, WA (1,366) stand out. While these metros may have stronger tenant protections or economic recovery efforts, many residents still face housing instability.
Housing Displacement by Disaster or Debt? How States Stack Up
The interactive chart above provides a detailed comparison of how each state ranks in these two categories. Here, we highlight states that stand out due to their risk profiles.
States with High Eviction and Foreclosure Risk but Low Disaster Displacement
Some states have relatively low rates of natural disaster-driven displacement but a high percentage of residents struggle to keep up with rent or mortgage payments. Maryland is a prime example, with only 354 adults per 100,000 residents displaced by disasters but 2,452 adults per 100,000 at risk of eviction or foreclosure—one of the highest rates in the country.
Georgia (1,342 displaced, 2,289 at risk of eviction) and Mississippi (1,424 displaced, 2,565 at risk of eviction) show a similar trend, suggesting that economic hardship plays a more dominant role in housing instability in these areas than natural disasters do.
States with the Highest Foreclosure Risk from Natural Disasters and Economic Hardship
Some states face a double burden—significant displacement from both natural disasters and financial strain. Louisiana leads the nation in disaster-driven displacement, with 3,990 adults per 100,000 residents forced from their homes in 2024, while also reporting 1,702 adults per 100,000 at risk of eviction or foreclosure.
Similarly, Texas (2,941 displaced, 1,878 at risk of eviction) and Florida (2,828 displaced, 1,686 at risk of eviction) rank high in both categories. These states regularly experience hurricanes, floods, and extreme weather events while also dealing with housing affordability challenges and economic pressures that put many residents at risk of losing their homes.
States with Low Foreclosure Risk from Both Factors
A handful of states experience relatively low housing displacement risks across the board. Utah has one of the lowest figures for both categories, with only 351 displaced adults per 100,000 residents and 728 at risk of eviction or foreclosure. Minnesota (291 displaced, 824 at risk of eviction) and Wisconsin (380 displaced, 1,001 at risk of eviction) also maintain low rankings in both metrics, suggesting more stable housing conditions overall.
Understanding the Growing Threat of Foreclosure in the U.S.
Housing instability in the U.S. is driven by two major forces: financial hardship and natural disasters. While some states face disproportionate risks from extreme weather, others struggle with high eviction and foreclosure rates. And in certain areas, both factors combine to create an especially volatile housing market.
Note: While this analysis focuses on formal displacement and eviction risk, many communities across the country also face rising housing insecurity due to a lack of affordable options. These conditions may not always result in displacement but still significantly impact residents’ quality of life and long-term stability.
“As these challenges continue to grow, understanding where the greatest risks lie is crucial for homeowners, renters, and investors alike,” says Jacob Neff, Executive Vice President at Deed Street Capital. “I encourage consumers to stay informed of financial alternatives, like seller-financed mortgages, and to take action early to protect their homes, investments, and financial futures. ”
In volatile markets, having a strategy to protect your investments—like selling a mortgage note—can provide much-needed financial flexibility and peace of mind. At Deed Street Capital, we make it easy to convert your mortgage note into cash with a fast, hassle-free selling process. Get a quote today and take control of your financial future—on your terms.
Methodology
We analyzed data from the 2024 Census Household Pulse Survey to rank states and the 15 largest U.S. metro areas for the highest displacement risk due to natural disasters and eviction or foreclosure risk.
Displacement risk was based on the percentage of adults in households forced to leave their homes due to a natural disaster in the past year, while eviction risk measured adults behind on rent or mortgage who believed eviction or foreclosure was very or somewhat likely in the next two months. To ensure fair comparisons, both metrics were normalized per 100,000 residents before ranking states and metro areas.
For regional insights, we grouped states into the four U.S. Census regions—Northeast, South, Midwest, and West—calculating total affected adults and population size for each. This allowed us to compare which regions face the greatest risks of displacement and housing instability, highlighting geographic patterns in disaster vulnerability and economic hardship.