
Where Did All the Banks Go? Tracking the Decline of Physical Branches Across America
Over the past two decades, physical bank branches have been disappearing across the U.S., reshaping the way Americans manage their finances. With the rise of online banking and financial technology, traditional brick-and-mortar banks are closing at a steady pace—leaving some communities with fewer options for in-person banking. But just how widespread is this phenomenon?
In this study, we analyzed data from the Federal Deposit Insurance Corporation (FDIC) to track the decline of physical bank branches across all 50 states and Washington, D.C. We examined which states have the most and least bank access, which states have retained the most physical branches, and the regions where in-person bank access is dwindling the fastest.
To better understand the current banking landscape, we also conducted a national survey exploring how Americans feel about the number of banks in the U.S., the impact of ongoing branch closures, their current banking preferences, and the rising trust in alternative financial options such as online lenders.
As fewer Americans rely on physical banks, alternative financial services are filling the gap. Read on to explore the data behind the shrinking footprint of traditional banks—and what this shift means for the future of financial transactions.
Bank Location Findings
- The U.S. has seen an overall 17% decline in physical bank branches over the past decade, with some states losing nearly one-third of their locations.
- 92% of Americans primarily use online banking, yet 85% still want the option for in-person services when needed.
- California ranks among the states with the least bank access per capita, despite being home to major financial hubs.
- 59% of Americans say bank closures wouldn’t affect them, but nearly 1 in 4 (23%) have struggled to access financial services due to a lack of physical branches.
- More than half of Americans (53%) trust nonbank financial services (e.g., online lenders, PayPal, Venmo) as much as traditional banks, signaling a major shift towards digital financial trust.
The U.S. States Losing the Most Banks—And Who’s Holding On
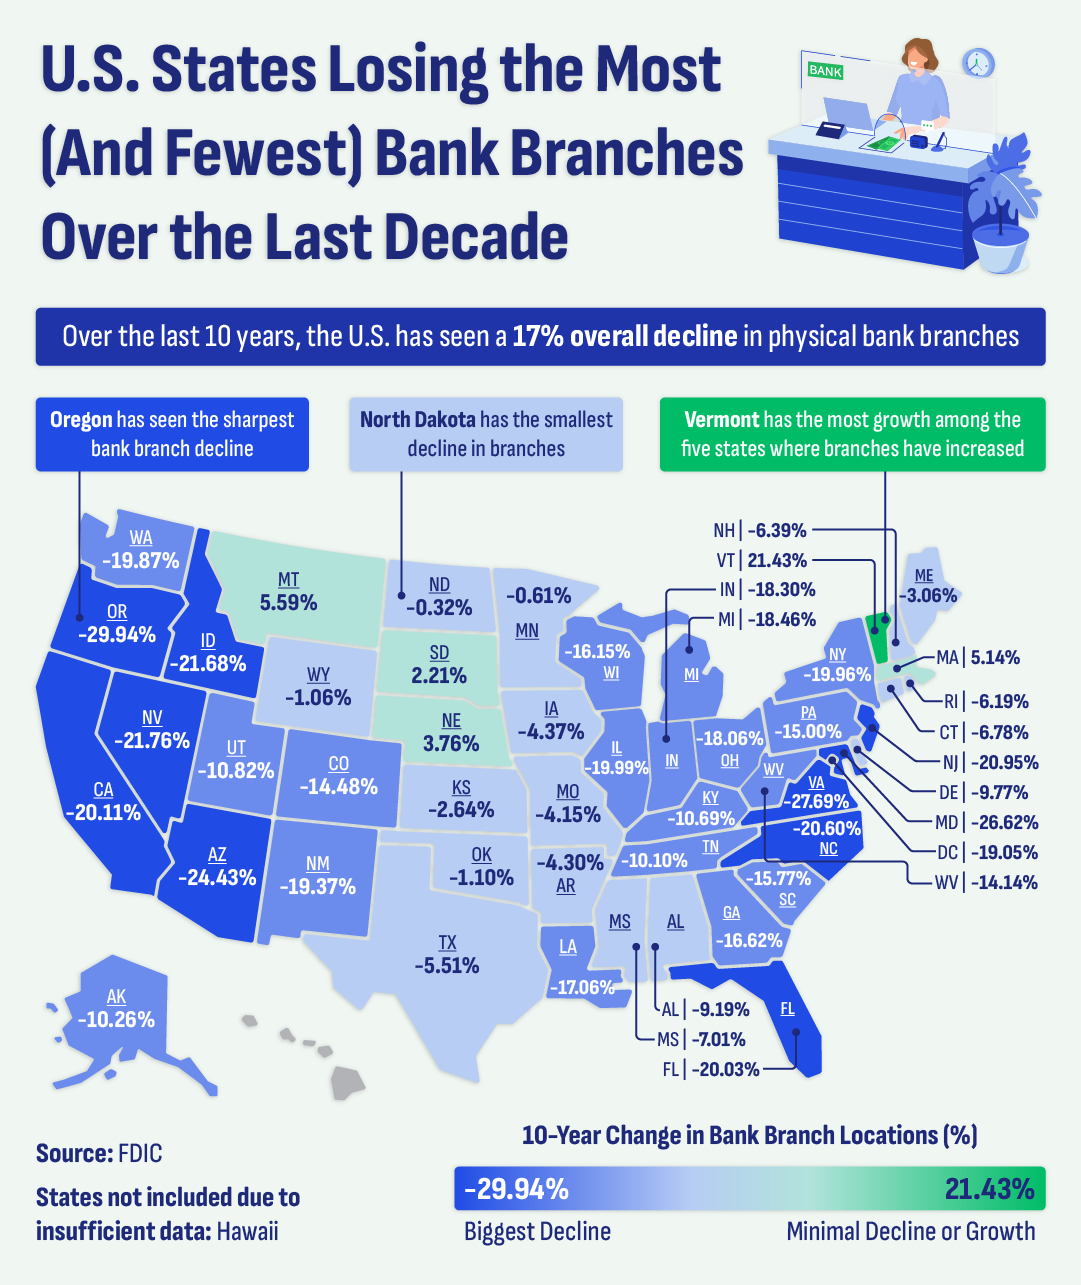
Over the past decade, the U.S. has experienced a 17% overall decline in physical bank branches, with some states seeing even steeper reductions. As online banking continues to dominate, traditional financial institutions are consolidating their physical locations, leaving many areas with fewer in-person banking options.
To better understand this shift, we conducted an analysis and analyzed the percent change in bank branches by state from 2013 to 2023. Some states have experienced significant closures, while others have managed to retain more locations—or even expand.
States with the Sharpest Decline in Bank Branches
Several states have experienced drastic reductions in physical bank locations, with some losing nearly one-third of their branches in just a decade.
- Oregon: -29.94% (315 branches closed)
- Virginia: -27.69% (684 branches closed)
- Maryland: -26.62% (410 branches closed)
- Arizona: -24.43% (309 branches closed)
- Nevada: -21.76% (109 branches closed)
- Idaho: -21.68% (111 branches closed)
- New Jersey: -20.95% (503 branches closed)
- North Carolina: -20.60% (510 branches closed)
- California: -20.11% (1,407 branches closed)
- Florida: -20.03% (1,038 branches closed)
The sharpest declines in bank branch numbers have occurred on the West Coast and in densely populated states like California, Florida, and New York—home to many of the country’s largest banking markets. In these areas, banks are increasingly adopting digital-first models, leading to reduced reliance on physical locations. Meanwhile, states such as Virginia and Maryland, which border the Washington, D.C. metro area, have also seen notable closures, likely tied to urban banking consolidation and shifting consumer behavior.
States with the Smallest Decline in Bank Branches
On the other end of the spectrum, some states have managed to retain most of their physical bank locations, with only minimal declines over the past decade.
- North Dakota: -0.32% (1 branch closed)
- Minnesota: -0.61% (8 branches closed)
- Wyoming: -1.06% (2 branches closed)
- Oklahoma: -1.10% (12 branches closed)
- Kansas: -2.64% (30 branches closed)
- Maine: -3.06% (7 branches closed)
- Missouri: -4.15% (83 branches closed)
- Arkansas: -4.30% (56 branches closed)
- Iowa: -4.37% (55 branches closed)
- Texas: -5.51% (344 branches closed)
Notably, rural and Midwest states have been more resistant to widespread bank closures. States like North Dakota, Wyoming, and Kansas have seen only marginal declines, possibly due to their reliance on community banking networks that serve smaller populations with fewer alternatives to in-person banking.
States with an Overall Increase in Physical Bank Locations
While the majority of states have seen a decline in bank branches, a select few have actually experienced growth in physical banking locations, highlighting regional differences in how financial institutions are expanding access and meeting community needs.
- Vermont: +21.43% (30 new branches)
- Montana: +5.59% (18 new branches)
- Massachusetts: +5.14% (65 new branches)
- Nebraska: +3.76% (32 new branches)
- South Dakota: +2.21% (8 new branches)
Interestingly, the Northeast and Upper Midwest have seen an expansion in physical bank locations, particularly in Vermont and Massachusetts. This could be attributed to a stronger presence of community banks and credit unions that continue to emphasize in-person customer service despite nationwide digital banking trends.
How Many Banks Are in the U.S.?
As physical bank branches continue to disappear, access to in-person banking varies widely across the country. While some states still have a strong banking presence, others are seeing fewer branches per capita, making in-person financial services harder to access.
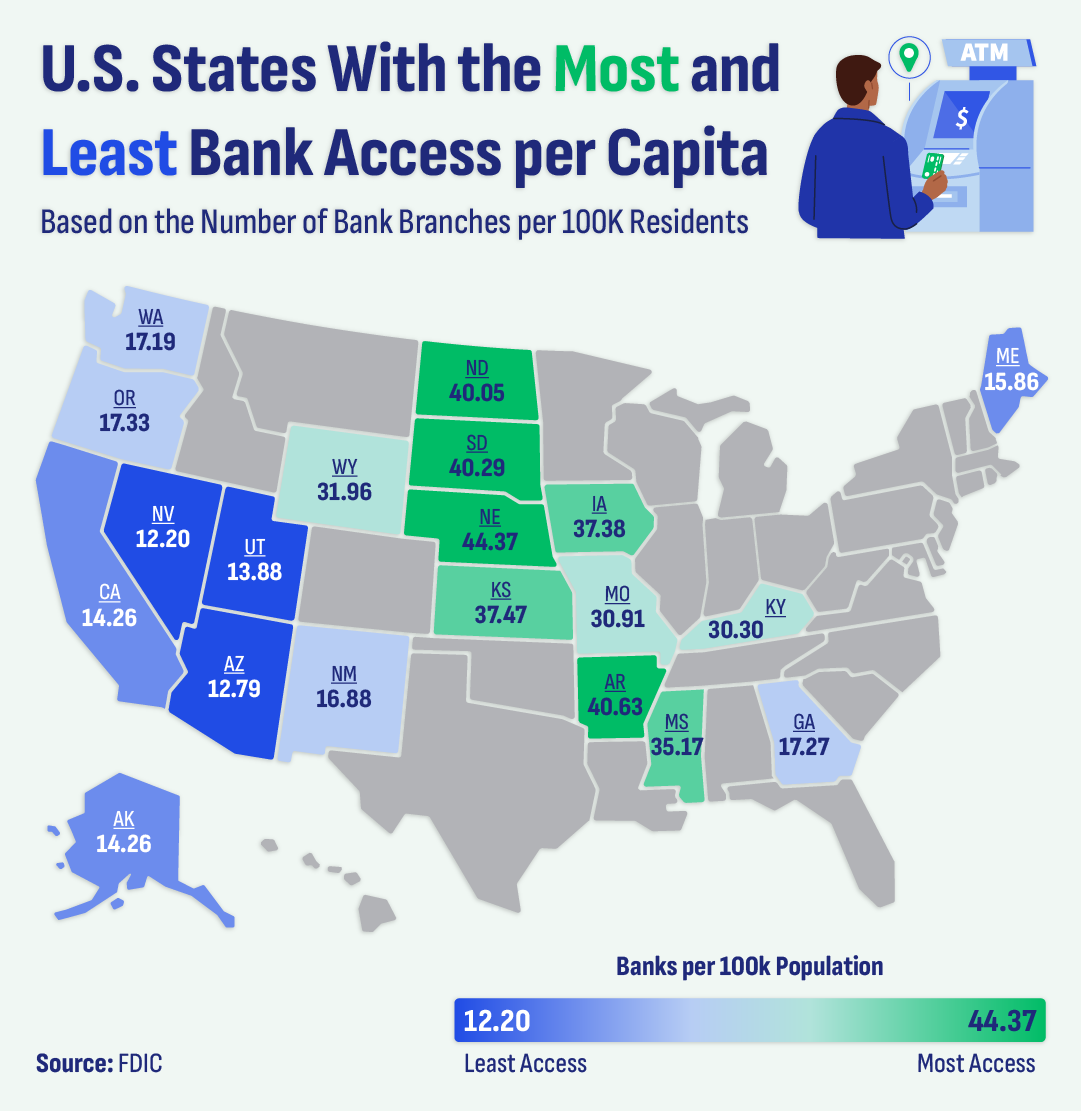
To better understand the landscape of bank availability, we analyzed the number of physical bank branches per 100,000 residents in each state. The results highlight two very different realities—some states maintain a dense network of branches, while others are becoming financial deserts.
U.S. States with the Fewest Banks per Capita
These states have the fewest physical bank branches relative to their population, meaning residents may have to travel long distances to find an in-person banking option.
- Nevada – 12.20 banks per 100k residents
- Arizona – 12.79 banks per 100k residents
- Utah – 13.88 banks per 100k residents
- California – 14.26 banks per 100k residents (tied)
- Alaska – 14.26 banks per 100k residents (tied)
- Maine – 15.86 banks per 100k residents
- New Mexico – 16.88 banks per 100k residents
- Washington – 17.19 banks per 100k residents
- Georgia – 17.27 banks per 100k residents
- Oregon – 17.33 banks per 100k residents
Many of the states with the lowest bank access are concentrated in the West, including Nevada, Arizona, and Utah. In these states, banking consolidation and a growing reliance on digital services have left many communities with fewer in-person financial options. Additionally, California, despite being home to a large population and major financial hubs, ranks 4th lowest for bank access per capita, indicating a significant shift toward online banking.
U.S. States with the Most Banks per Capita
On the other end of the spectrum, these states maintain the highest concentration of bank branches per capita, providing greater access to in-person financial services.
- Nebraska – 44.37 banks per 100k residents
- Arkansas – 40.63 banks per 100k residents
- South Dakota – 40.29 banks per 100k residents
- North Dakota – 40.05 banks per 100k residents
- Kansas – 37.47 banks per 100k residents
- Iowa – 37.38 banks per 100k residents
- Mississippi – 35.17 banks per 100k residents
- Wyoming – 31.96 banks per 100k residents
- Missouri – 30.91 banks per 100k residents
- Kentucky – 30.30 banks per 100k residents
The states with the most bank access are predominantly rural and Midwestern, where community banks continue to play a crucial role in serving local populations. Nebraska, South Dakota, and North Dakota lead the nation in per capita bank access, reinforcing the importance of regional banks in areas where large financial institutions have not consolidated services.
Americans Are Banking Online—But They’re Not Ready to Give Up Branches Yet
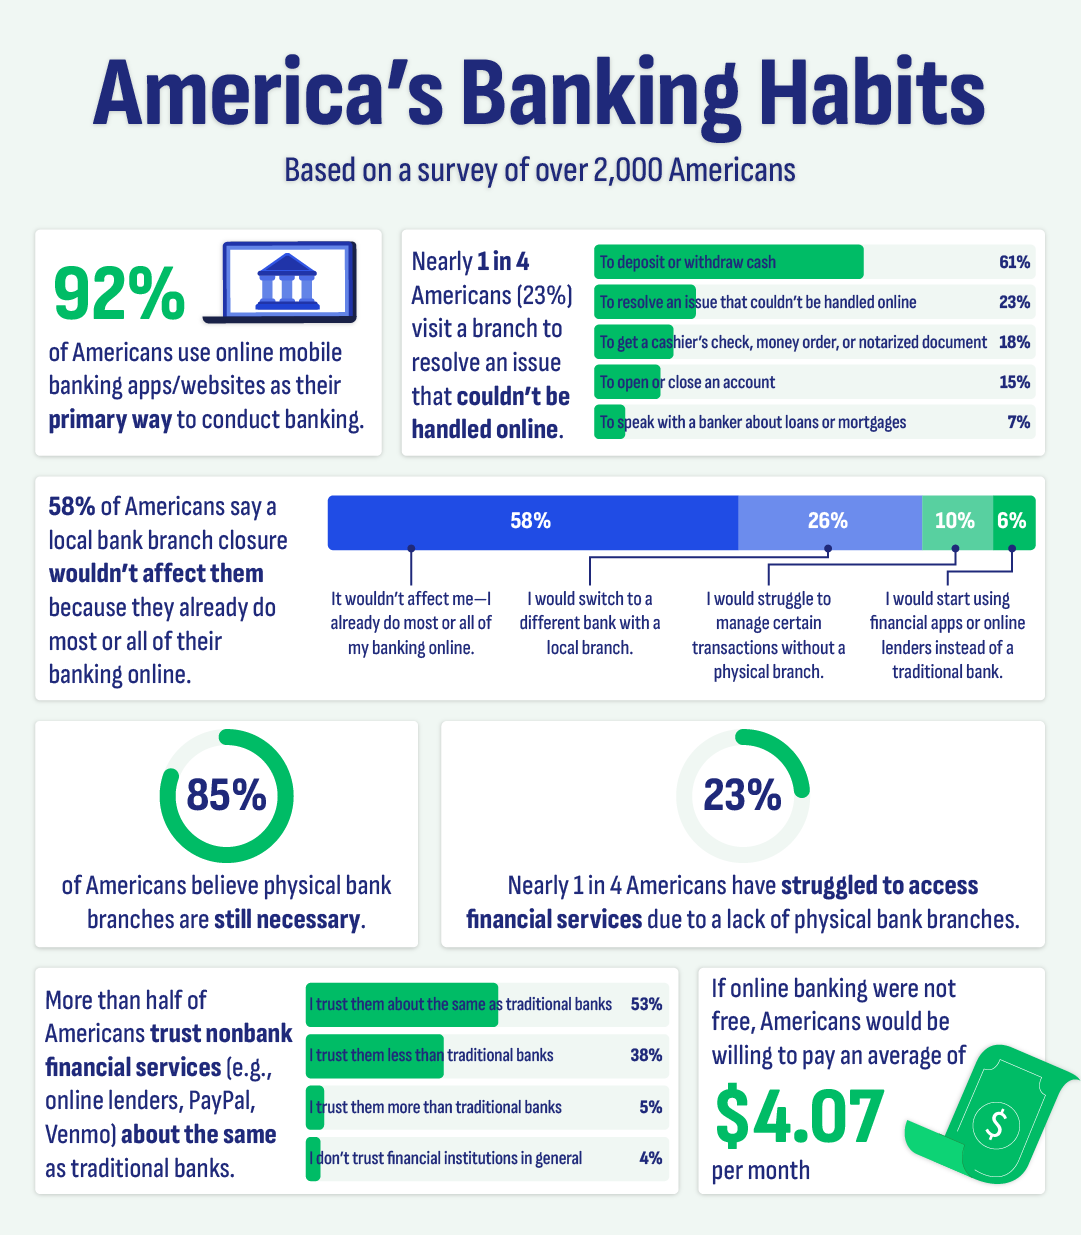
The rise of online banking has fundamentally changed how Americans manage their finances. Our survey data reveals that while 92% of Americans rely primarily on online banking, physical branches still hold value—particularly for problem-solving and specific transactions. In fact, 85% of respondents believe banks should maintain in-person services, even if they don’t visit branches regularly.
That said, day-to-day reliance on physical bank locations is declining. Only 5% of Americans say they primarily bank in person, and just 6% visit a branch at least once a week. The most common frequency for in-person banking is a few times a year (40%), while 29% say they rarely visit a branch—just once a year or less. When they do go, it’s usually for basic transactions like withdrawing or depositing cash (61%) or resolving issues that can’t be handled online (23%).
While digital banking is the norm, most people still notice the shrinking footprint of physical banks. Over 55% of Americans say they’ve observed a decline and losses in local bank branches over the past decade. Interestingly, they tend to overestimate the closure rate—on average, respondents believe 23% of bank branches have closed in the past ten years, when the actual figure is 17%. Older generations are particularly aware of these closures—60% of adults aged 43+ say they’ve noticed fewer branches, compared to 48% of Millennials (27-42) and 49% of Gen Z (18-26).
When it comes to who still relies on physical banking, age plays a significant role. Older Americans (59+) visit branches the most—27% say they go a few times a month, and 18% have visited within the last week. In contrast, younger Americans (18-26) visit branches the least frequently—34% rarely go in person, and only 3% visit weekly. However, Gen Z is the most likely to use branches for setting up accounts—24% have visited a bank specifically to open or close an account.
If local branches were to close, most Americans wouldn’t feel significantly impacted. 59% say they wouldn’t be affected because they already conduct most of their banking online. However, 10% admit they would struggle to manage certain transactions without access to a branch, and 26% would switch to a different bank with a local branch. Notably, just 6% say they would turn to financial apps or online lenders if their bank shut down its physical locations.
Despite the shift toward digital banking, the traditional banking industry still holds an edge in trust— 53% of Americans say they trust nonbank financial services like PayPal, Venmo, and online lenders about the same as traditional banks, while 38% trust them less. Younger and older generations are the most skeptical—41% of both 18-26-year-olds and 59+ respondents report lower trust in nonbank financial services compared to traditional banks.
Even though online banking is free, Americans see it as an essential service they’d be willing to pay for—on average, respondents would spend $4.07 per month for access to digital banking if it weren’t included with their accounts. Younger adults (18-26) are the most willing to pay, averaging $5.18 per month, while older Americans (59+) would pay the least, at $3.55 per month.
However, the transition to a fully digital financial system isn’t seamless—nearly 1 in 4 Americans (23%) have struggled to access financial services due to a lack of physical bank branches. While online banking dominates, these insights suggest that a hybrid model—where physical locations exist for occasional but critical banking needs—may be the best way forward.
What Fewer Physical Banks Mean for Real Estate and Financial Flexibility
The decline of physical bank branches isn’t just changing how Americans manage their money—it’s reshaping financial accessibility.
Jacob Neff, Executive Vice President at Deed Street Capital, explains, “As more bank branches close, access to traditional lending is shrinking. We’re seeing a growing reliance on alternative financial solutions, like seller-financed mortgage notes, to fill the gap.”
With traditional lending becoming less accessible, seller-financed mortgage notes have become an increasingly valuable tool for those in need of buying a home without going through the bank. However, for sellers, this option often comes with limited liquidity, as they receive payments over time instead of an upfront lump sum.
If you’re looking for a faster, more flexible way to access the cash tied up in your mortgage note, Deed Street Capital provides a seamless, hassle-free process to sell your note and unlock your equity entirely online. Get a quote today and take control of your financial future.
Methodology
To examine the decline of physical bank branches across the U.S., we analyzed historical FDIC data on the total number of branches per state* from 2013 to 2023, the most recent available data. In addition to tracking the percentage change in total branches over this period, we also calculated branches per 100,000 people, both nationally and by state, to account for population changes.
This allowed us to identify which states experienced the most significant declines, where access to physical banking has diminished the most, and which states have seen an overall increase in branches over the decade.
Additionally, we surveyed over 2,000 people to gain insights into how often people use physical bank branches and how affected they feel by such closures.
*Hawaii is excluded due to insufficient year-over-year branch data.